Data Mining Techniques
Data Mining Methods
Data mining techniques are the specific methods used to carry out the "Data Mining" step of the KDD process — the point where prepared data is actually analyzed to surface hidden patterns, relationships, and insights. They draw on statistics, mathematical methods, artificial intelligence, and machine learning algorithms such as neural networks, decision trees, regression models, and clustering algorithms.
It helps to keep two layers separate: an algorithm (like a decision tree or a neural network) is the specific method that does the computing, while a technique (like classification or clustering) is the task that algorithm is being used to accomplish. The same task — classification, for instance — can be carried out by several different algorithms, including decision trees, neural networks, or statistical models.
The most important data mining techniques are:
- Classification
- Clustering
- Regression
- Association Rule Mining
- Outlier Detection
- Sequential Pattern Mining
- Prediction
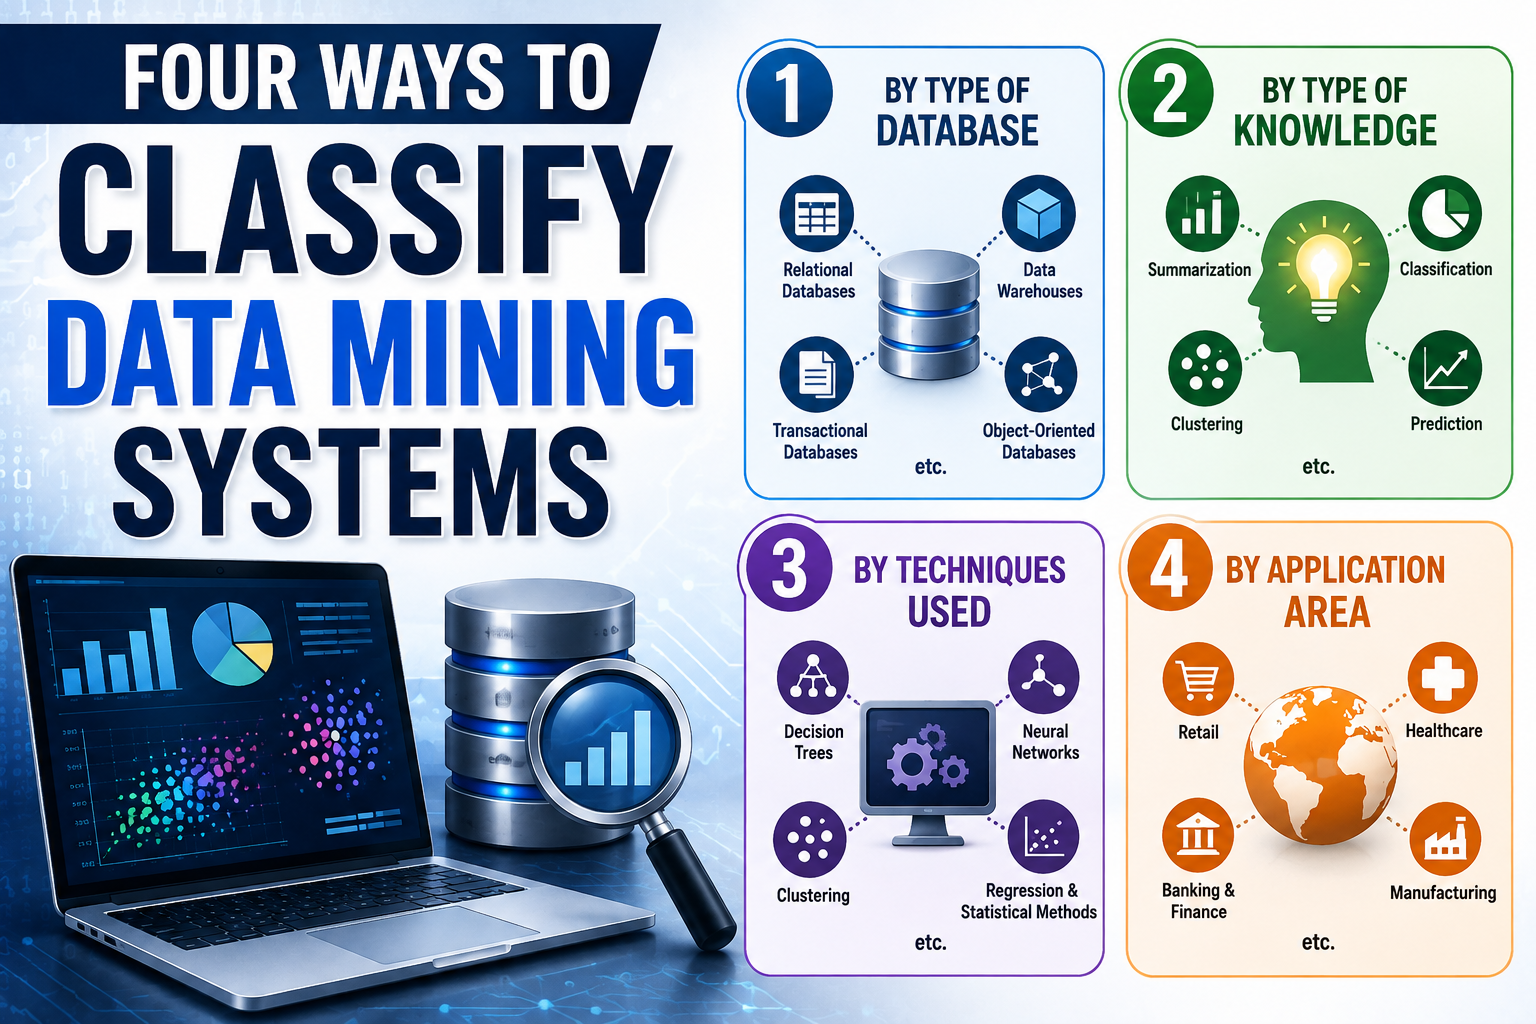
How Data Mining Systems Are Classified
Before going through the seven techniques above, it's worth clearing up a naming collision: data mining literature also uses the word "classification" to describe how entire data mining systems (not individual techniques) are categorized. This is a different concept from the Classification technique covered next — it's a broader way of describing an approach to data mining as a whole. Systems are typically grouped by:
- Data source — the kind of data being mined, such as text data, multimedia data, spatial data, time-series data, or web data
- Database type — the kind of database the system works with, such as relational, object-oriented/object-relational, or transactional databases
- Kind of knowledge mined — the type of knowledge the system is designed to extract, such as classification, clustering, characterization, or discrimination (many real systems combine more than one of these)
- Technique or approach used — the underlying method, such as machine learning, neural networks, genetic algorithms, statistical methods, or data visualization
- Degree of user interaction — whether the system is query-driven, fully autonomous, or interactive
With that distinction in mind, here are the seven core data mining techniques.
1. Classification
Classification is a supervised learning technique used to assign data into predefined groups or classes. An algorithm learns from labeled training data — data where the correct category is already known — and then applies what it learned to classify new, unseen data.
For example:
- Email → Spam or Not Spam
- Loan Application → Approved or Rejected
- Customer → High Value or Low Value
Because the categories are defined in advance and the algorithm is trained on examples that already carry those labels, classification only works as well as the labeled training data it's given — biased or unrepresentative training data produces a biased classifier.
2. Clustering
Clustering is an unsupervised learning technique used to group similar data points together. Unlike classification, clustering does not start with predefined categories — it discovers natural groupings directly from the structure of the data.
For example, a company might group customers based on:
- Purchase behavior
- Age group
- Location
- Interests
This lets a business design a different marketing strategy for each group rather than treating every customer the same way. Clustering is widely used in text mining, Customer Relationship Management (CRM), image processing, web analysis, medical diagnostics, and bioinformatics.
In simple terms: clustering groups similar data items together based on how similar they are to each other, without being told in advance what the groups should look like.
3. Regression
Regression is a statistical technique used to model the relationship between variables, so that the value of one variable can be predicted from another. Unlike classification, which predicts a category, regression predicts a continuous numeric value.
For example:
- Predicting house prices based on location and size
- Predicting sales based on advertising spend
- Predicting demand based on market trends
Regression helps businesses with forecasting, planning, and trend analysis by providing a mathematical relationship between two or more variables.
4. Association Rule Mining
Association Rule Mining discovers relationships between items that frequently appear together in the same transaction. These relationships are usually written as If–Then rules — for example, "If a customer buys a laptop, they may also buy a mouse." This technique is the foundation of Market Basket Analysis.
Measuring an Association Rule
Three measurements determine whether a discovered rule is actually useful, rather than a coincidence:
| Measure | What it tells you | Formula |
|---|---|---|
| Support | How frequently A and B appear together, out of all transactions | (Transactions containing both A and B) ÷ (Total transactions) |
| Confidence | Given that A was bought, how often B was also bought | (Transactions containing both A and B) ÷ (Transactions containing A) |
| Lift | How much more likely A and B are bought together than by pure chance | Confidence(A → B) ÷ Support(B) |
A worked example makes this concrete. Suppose a store records 100 transactions:
- 30 transactions include bread
- 25 transactions include butter
- 20 transactions include both bread and butter
For the rule "If bread, then butter":
- Support = 20 ÷ 100 = 0.20 (20% of all transactions include both items)
- Confidence = 20 ÷ 30 ≈ 0.67 (67% of customers who buy bread also buy butter)
- Lift = 0.67 ÷ 0.25 ≈ 2.67
A lift greater than 1 means the two items are bought together more often than random chance would predict — here, customers who buy bread are about 2.67 times more likely to also buy butter than an average customer is. A lift close to 1 would mean there's essentially no real relationship between the two items, even if support and confidence look reasonable on their own.
5. Outlier Detection
Outlier detection identifies data points that differ significantly from the rest of the dataset. These unusual data points are called outliers, and finding them is useful in fraud detection, network intrusion detection, credit card fraud detection, medical diagnosis, and sensor data monitoring.
For example, if a customer's typical transaction is around ₹500 but a transaction of ₹2,00,000 suddenly appears, that transaction may be flagged as an outlier worth investigating. Outlier detection helps organizations catch unusual patterns and potential risks that would otherwise blend into normal-looking data.
6. Sequential Pattern Mining
Sequential Pattern Mining identifies patterns in the order in which events occur over time, rather than just which items occur together. It analyzes sequences of events to discover relationships between them.
For example, tracking one customer's purchases over time might show:
Day 1  → Laptop
Day 5  → Laptop Bag
Day 10 → Mouse
Recognizing this sequence across many customers helps a business understand typical purchasing paths — for instance, to trigger a "you might also need a mouse" recommendation shortly after a laptop purchase. Sequential pattern mining is commonly used in e-commerce analysis, web usage mining, and customer behavior analysis.
7. Prediction
Prediction forecasts future events based on historical data, often by combining several of the techniques above — classification, clustering, trend analysis, and regression — rather than relying on just one. Where regression specifically models the mathematical relationship between variables, prediction is the broader, applied goal of estimating what will happen next, using whichever combination of techniques gets there.
Common examples include predicting stock prices, customer demand, disease outbreaks, and product sales. Because it draws on multiple techniques at once, prediction plays a central role in business intelligence and decision-making.
Choosing the Right Technique
| If your goal is to... | Use this technique |
|---|---|
| Assign new records to categories that are already known | Classification |
| Discover natural groupings with no predefined labels | Clustering |
| Predict a numeric value | Regression |
| Find items or events that occur together | Association Rule Mining |
| Flag unusual or abnormal records | Outlier Detection |
| Understand the order in which events happen over time | Sequential Pattern Mining |
| Forecast a future outcome using several methods at once | Prediction |
Most real data mining projects don't rely on a single technique in isolation. A retailer, for example, might use clustering to segment customers, association rule mining to understand what each segment tends to buy together, and prediction to forecast demand for the next quarter.